Climate Gap Report 2022


Rob Harrison and Josie Wexler introduce introduce Ethical Consumer's second annual report: Closing the Climate Gap 2022: An annual report on progress towards sustainable consumer lifestyles in the UK.

18th October 2022

Our Climate Gap reports aim to annually track the gap between our current combined consumption emissions and where they need to be by 2030. They also aim to produce a simplified list of key actions for consumers, companies and governments, and these appear across the five report cards (summary, food, heating, transport, and consumer goods).

In this second annual report we discuss how well consumers, companies and the government have worked together to achieve these goals.

For the 2023 report visit the Ethical Consumer Climate Gap report special page.

Key findings from the 2022 report

The report card below summarises our key findings from the 2022 report, across food, heating, transport and consumer goods, and covering around 75% of our collective total consumer emissions.

It looks at how much we must cut our emissions by by 2030 to meet UK targets in each of these areas, and whether we are moving fast enough towards these goals. It then highlights the key actions we must - as consumers, governments and businesses - take.

Summary Report Card 2022
  Food (26%) Heating (14%) Transport (25%) Selected Consumer Goods (10%)
Consumer-related emissions reductions needed by 2030 in this scenario (from a 2019 baseline) c.15% CO2e reduction c.23% CO2e reduction c.17% CO2e reduction c.40% CO2e reduction
What reductions were achieved in the most recent year’s figures? 0% reduction 6% CO2e reduction 15% reduction 1.7% increase
The current climate gap. What is the remaining reduction needed? 15% still to reduce 23% still to reduce 2% still to reduce 40% still to reduce
Are we moving fast enough? No, but... No Yes, but... No, but...
What does government need to do? Rebalance agricultural policy Subsidise solutions Halt airport expansion Change company reporting law
What do companies need to do? More plant options on menus Develop creative funding Replace business travel Report supply chain emissions
What do consumers need to do? Reduce meat and dairy consumption by 20% Insulate; do smarter heating; choose heat pumps where possible Choose electric vehicles; reduce travel where possible Increase repair and buying second hand

c. = circa or approximately

1. Transport emissions are down

Transport emissions have been distorted by the pandemic. Emissions in 2021 were still well down on 2019 levels, but this is entirely due to the travel restrictions. This makes long term progress in transport hard to glean, but electric car registrations are on track. The green square in the the summary table in the report is unlikely to be the same colour next year!

2. Meat and dairy are possibly on track

The UK Government’s own Climate Change Committee (CCC), whose data we have used extensively in our reports, thinks that reduction in meat and dairy consumption is also on track, although the figures are a bit unclear.  We discuss this more in the food section.

3. Home heating is still a car crash!

The UK is keeping up its tradition of doing very badly on heating. Insulation and heat pump installations need to speed up dramatically. There has also been a COVID-affected rise in home heating emissions. This is likely to change this winter as fuel prices impact, tragically, the poorest in our society most acutely.

4. Buying second hand and repairing are on the rise

Our own survey data shows significant increases in buying second hand and repairing this year. In theory this should lead to real reductions in consumption of new goods, and feed through to reduced carbon figures in time, though this is not visible in the data yet.

5. Company carbon reporting is moving at pace

Proper reporting of full company emissions rose from 37% to 60% of the companies we surveyed this year. Whilst this is good, there are still critical issues with the quality of some of this reporting and little evidence that emissions reported are moving in the right direction at the right speed. What data we do have, which is old, shows emissions growth which is why the consumer goods sector, as a whole, is marked red (in the pdf).

6. Some possible food waste reductions

Research from WRAP suggests the pandemic also saw short-lived positive changes in household food waste, as people had more time to plan and prepare food. But there are no government figures available for this since 2018, so we aren’t reporting on this indicator this time.

7. We’re not moving fast enough

Now that transport emissions are returning to normal, UK consumption emissions reductions as a whole are not on track. This is not really news to anyone involved in climate campaigning and is true of wider UK (and international) emissions too.

8. The quality of data needs urgent attention

When we try to answer the climate gap question, we are finding that, in some cases, the best available data is three years old. It is not possible to manage an economy rationally towards urgent climate goals without meaningful and timely performance data. It is instructive to compare the resources the ONS has to produce (say) monthly inflation figures, with those it has for climate impact reports.

Other key management tools – like Home Energy Performance Certificate (EPC) ratings – need urgent attention too. See the heating section.

9. Intentions to adopt sustainable behaviours are on the rise

Of the twelve areas we looked at, consumer intentions or actions to make more sustainable choices increased in seven areas and stayed the same in five. This shows a general trend towards an increasing understanding of the need to adopt more sustainable consumer behaviours in the UK.

10. Governments are not always leading the way

Overall our report provides some evidence that, even when you have a government which appears openly hostile to taking timely climate actions, external events (like the pandemic), and positive action from independent actors (like companies and consumers) can mean that progress is not always or entirely stalled.

Change does not exclusively happen in a top down way, and even the worst governments are constrained in what they can do by external events and external forces. This is a small comfort in difficult times.
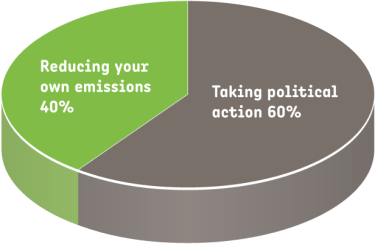
Pie chart: taking political action 60%; reducing your own emissions 40%

A new section on key political actions for consumers

As we mentioned last year, at Ethical Consumer we have long recognised that the decisions that consumers make, and around climate change particularly, are so dependent on the frameworks that government and companies provide that it is not particularly helpful to look at consumer choices or personal carbon footprints in isolation. (We first wrote on this in EC27 on January 1994.)

Our Climate Gap reports are therefore designed to feature key consumer actions alongside what companies and governments need to do in each specific area. This can give consumers a sense that they are part of something bigger as well as highlighting some key political campaigns that might be worth supporting.

Last year we quoted Mike Berners-Lee who felt that the balance of effort for individuals between political action and consumption reductions should now be around 60 to 40, as represented in the diagram, and are discussed in more detail in Section 6 of the report.

To emphasise this fact this year, we’ve decided to publish [as a separate supplement] a ‘top five political actions for consumers’ for each of the four impact areas of our climate gap report: Food, Heating, Transport and Consumer Goods. This is because governments and companies may not always choose to do the things they need to do (also listed in the report cards) without a push from consumers as citizens.

These will complement the ‘What do consumers need to do’ sections on each of our report cards which look just at personal consumption reductions, and are discussed in more detail in Section 6 of the report.

Cover image of report with tree in background. Closing the climate gap 2022.

Background to the 2022 report

Data for the first three areas of our report (Food, Heating and Transport), and the targets for reduction, are mainly taken from annual reports issued by the UK Government’s own Climate Change Committee (CCC). The CCC was set up under the Climate Change Act 2008 to advise UK governments on decarbonisation, and it has a plan for reductions across the whole UK economy in line with international agreements (both UK and Scottish).

For the fourth impact area, Consumer Goods, we have conducted our own research. We provide more details about the CCC’s reports, and on the calculations, indicators and goals we have chosen to use, in our inaugural 2021 Climate Gap report.

The 2021 Report is still available to download.

Structure of the 2022 report

As last year, our report is focussed on the four ‘impact areas’ that we calculated to be the most important ones for consumers to reduce carbon impacts. Each impact area has a ‘Report Card’ which summarises the key issues on one page. The four areas are:

  • Food
  • Heating
  • Transport
  • Selected Consumer Goods

In addition there is a ‘Summary Report Card’ which further distils information from each of the four cards into a single view and which appears in our Key Findings section.

The report cards were also published in issue 199 of Ethical Consumer magazine.

Summaries for each of the four areas are available via our consumer campaign page about the Climate Gap report.

We would like to express gratitude to the Ecology Building Society for its sponsorship of the 2022 Climate Gap Report.

Ecology Building Society logo

Feedback from our 2021 special conference sessions

After the launch of last year’s report, we invited a wide range of civil society organisations and ethical companies to come along to some focussed sessions during our Ethical Consumer Week in 2021. Here we asked them, and of course other attendees from our community, whether we had got our calls to action right, or whether there are others that should be given priority?

We have included some feedback from these sessions under the separate impact areas. The feedback also played an important role in helping us to shape section 6 of this report, our key political actions for consumers.