Home appliance brands and sustainability


Home appliance brands improve their sustainability performance during the pandemic, but much remains to be done

August 2022

Marlous Veldt presents the findings from an in-depth ranking study looking at sustainability inside 44 manufacturers of fridges, washing machines, TVs and vacuum cleaners.

Two years ago, a research partner approached Ethical Consumer Research Association with the question: could you rate the sustainability of the most popular white goods and television brands in the UK for us?

During 2020 and 2021, we created a bespoke scoring system and monitored how each company's sustainability performance changed over that period.

Main findings

The main scoring table below shows that, of the 44 companies rated during the period from May 2020 to July 2021, 25 (57%) improved, 14 (32%) stayed the same, and 5 (11%) got worse. This shows strong evidence that the direction of travel over the period was for improved engagement with sustainability issues.

Overall though, performance left a lot be desired.

Only 13 (30%) of the 44 companies appeared to demonstrate a reasonable understanding of the sustainability issues that were relevant to them and of the need to take action with immediate effect.

Total scores over time - listed in order of company with highest final score

Company

Brands May '20 Aug '20 Oct '20 Dec '20 Feb '21 Apr '21 July '21

Change between first and final report

LG Corp LG 76 76 76 76 76 76 78 2
Ikea group (INGKA) Ikea 66 66 66 66 71 71 71 5
Sharp Corp Sharp 65 65 65 70 70 70 70 5
Samsung Group Samsung 71 70 70 70 70 70 70 -1
AB Electrolux AEG/Zanussi 64 65 65 65 65 65 65 1
Sony Corporation Sony 62 62 62 62 62 62 62 0
Panasonic Corporation Panasonic 56 56 60 60 60 60 60 4
Amazon Corp Amazon 39 53 53 53 53 53 60 21
Toshiba Corporation Toshiba 49 49 49 52 58 58 58 9
Whirpool Corp Hotpoint/Whirlpool/Indesit 57 57 57 57 57 58 58 1
BSH Group Bosch/Neff/Siemens 43 50 50 50 50 53 56 13
Miele & Cie. KG Miele 54 54 54 54 54 54 54 0
Dixons Carphone Essentials/Logik/Currys 48 51 51 51 51 51 51 3
Arçelik A.Ş. Beko/Grundig/Blomberg 44 48 48 48 48 43 50 6
John Lewis Partnership John Lewis 50 49 49 49 49 49 49 -1
Sainsbury’s (Argos) Bush 49 46 46 46 46 46 49 0
JVC KENWOOD UK JVC 51 51 51 51 51 44 44 -7
Techtronic Industries Vax 33 33 33 33 33 33 44 11
Liebherr International AG Liebherr 42 42 42 42 43 43 43 1
Spectrum Brands Russell Hobbs 38 38 38 39 39 39 39 1
JS Global Lifestyle (SharkNinja) Shark 0 0 0 0 0 25 37 37
UP Global Sourcing Beldray 0 0 0 0 0 35 35 35
Alfred Kärcher GmbH Kärcher 13 27 27 35 35 35 35 22
De’Longhi Industrial SpA Kenwood 31 31 31 33 33 33 33 2
TPV Technology Ltd Philips Televisions 26 20 20 20 20 30 30 4
Haier Group Fisher & Paykel/Haier 13 29 29 29 29 29 29 16
Ebac Foundation Ebac 25 25 25 25 25 25 25 0
Haier/Candy Hoover Group Candy/Hoover/Baumatic 8 8 24 24 24 24 24 16
Adeva H. Koenig 0 0 0 0 0 0 19 19
Numatic International Ltd Numatic (Henry) 25 25 25 25 25 15 15 -10
Glen Dimplex Belling/Lec 12 12 5 10 10 10 10 -2
CDA Group CDA/Amica 10 10 10 10 10 10 10 0
Maurice Lay Distributors Caple 10 10 10 10 10 10 10 0
Newbury Investments etc Bissell 7 7 7 7 7 7 7 0
Smeg SpA Smeg 7 7 7 7 7 7 7 0
Stein & Co GmbH Sebo 0 3 3 0 7 7 7 7
Hisense Hisense/Gorenje/Fridgemaster 5 5 5 5 5 5 5 0
Dyson Limited Dyson 0 3 3 3 3 3 3 3
Swan Products Ltd Swan 2 2 2 2 2 2 2 0
Loxley Benedict Limited (formerly: Crosslee Holdings) White Knight 0 2 2 2 2 2 2 2
The Kirby Company Kirby 0 0 0 0 0 0 0 0
Domu Brands Limited Von Haus 0 0 0 0 0 0 0 0
Montpellier Appliances Montpellier 0 0 0 0 0 0 0 0
Shinemart Ltd Duronic 0 0 0 0 0 0 0 0

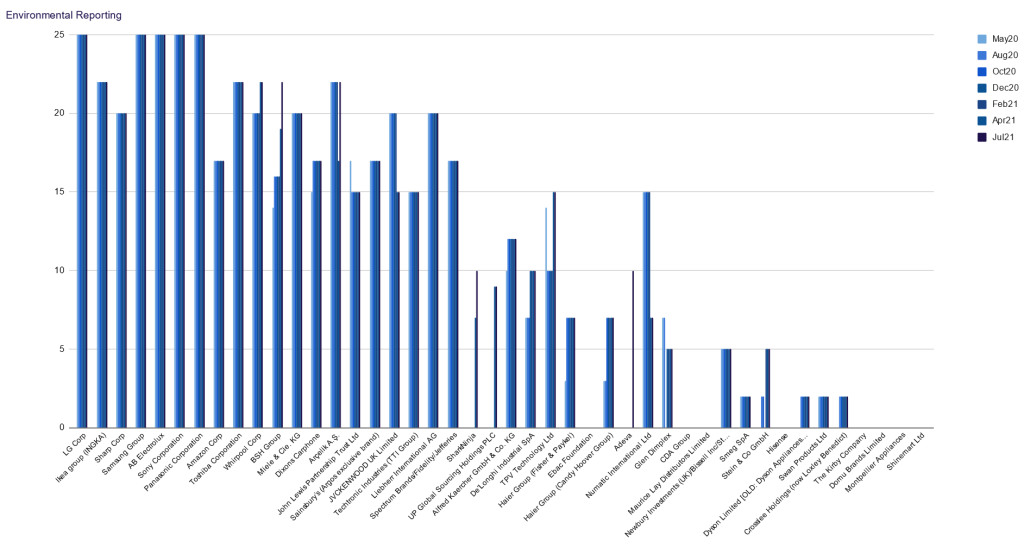
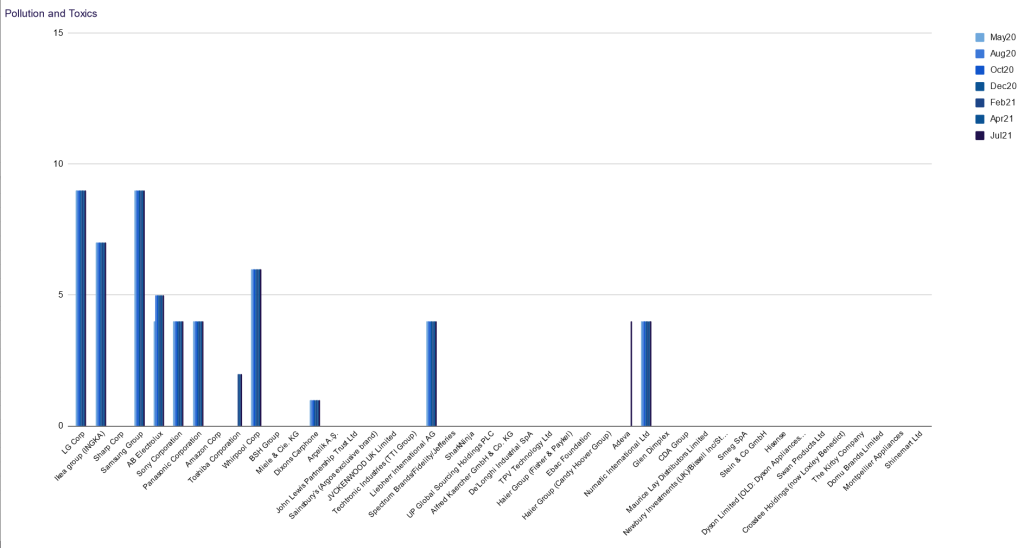
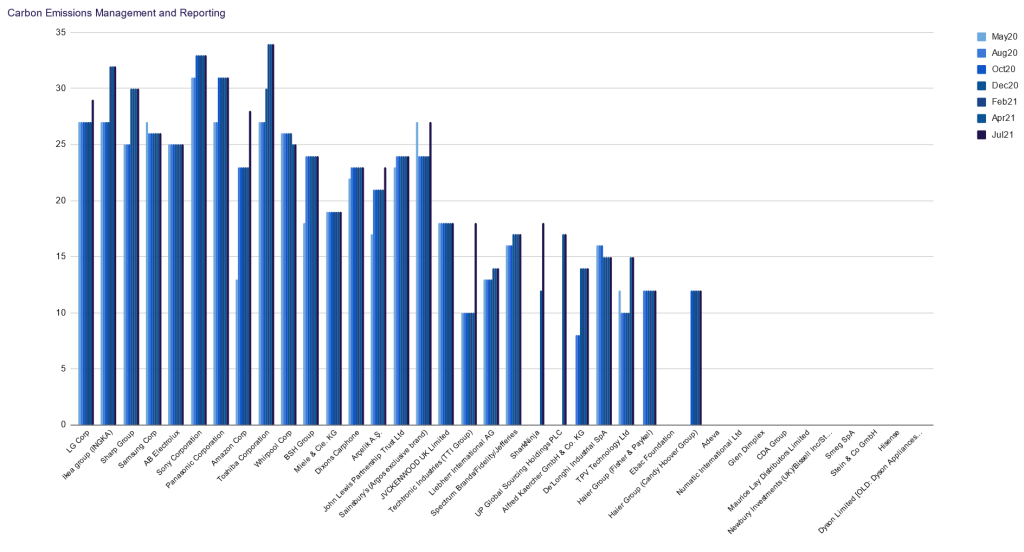
The following three charts give a visual overview of how companies scored on the different categories throughout the project: carbon emissions management and reporting, environmental reporting, and pollution and toxics. The charts show the companies ranked by their score in the final update, from July 2021.

Carbon emissions management and reporting graph

Detailed chart with 44 brands and their ratings on carbon emissions management and reporting

Environmental reporting graph

Detailed chart with 44 brands and their environmental reporting scores

Pollution and toxics reporting graph

Detailed chart with 44 brands and their scores for pollution and toxics

Which companies scored best for sustainability over time?

LG Corp was the top scoring company in all reports. In May 2020, it had 76 out of 100 points, which went up to 78 in July 2021. Samsung, Sharp and Ikea also scored above 70 in the final report. The company that made the biggest improvement was Alfred Kaercher GmbH, with an increase of 22 points, closely followed by Amazon, with 21 points.

Most of the positive changes in scores came from companies’ improved carbon reporting. Some of the companies that ended with fewer points than they had at the start did not publish a sustainability report at the time they normally would and lost points because their environmental targets had fallen out of date. This delay could be because of the Covid-19 pandemic.

The number of companies that scored zero across all categories was ten during the first round of research and went down to four in the final update. Four companies – Stein & Co, Loxley Benedict/Crosslee Holdings, Dyson and Adeva – added sustainability information to their websites or reports during the project. The final four vacuum cleaner manufacturers did not provide any relevant information at any point of the project: the Kirby Company, Domu Brands Limited (Von Haus), Montpellier Appliances and Shinemart Ltd (Duronic).

Sustainability reports published towards the end of the project were more focussed on carbon emissions than the ones we found during the initial data-gathering phase. Although this is a welcome development, we also observed a tendency for companies to replace environmental impact targets for their use of energy, water and raw materials with one or two general carbon reduction targets that didn’t say much about what the company is planning to change about their operations.

It will be interesting to see whether companies manage to move forward from the current phase of figuring out how much carbon they produce, to setting and sticking by decarbonisation targets that actually reduce the carbon impact of their production and retail operations.

Research design

Because of our research partner's desire to focus on sustainability we decided to only look at the environmental criteria that we use to rank companies in our consumer buyers guides. These were:

  • carbon reporting (35% of the score)
  • environmental reporting (25% of the score), and
  • the use of toxics commonly found in electronic goods (15% of the score)

We also chose to find out the percentage of each company's products scoring the best available EU energy efficiency rating (25% of the score). This proved to be quite a challenging task; one company advertised more than 750 different television set models on their website! And In March 2021, the European Union energy labelling used for this part of the research changed to a simplified A to G ranking and this ranking is therefore no longer up to date.

Finally, our partner wanted us to rank the companies from best to worst and monitor changes in their score every two months for a year. This was an interesting exercise for us as well, since Ethical Consumer usually updates its product guides every two to three years and we were curious to see if the same companies came out top and bottom throughout the year. Because of the practical issues mentioned above, we only performed this exercise for the first three (policy) ranking areas.

The initial data gathering took place between February and June 2020. Update reports were written in August, October and December 2020 and February, April and July 2021. As we do for our product guides, we started by sending surveys to all companies with questions about the issues we were rating. Together with searches of companies’ websites, annual reports and sustainability reports, this formed the basis of our initial report. For the updates, we went back to these sources and updated companies’ data sheets with any new information found.

The response rate of 16% was better than average for our research reports, perhaps because it was unclear at the beginning whether there would be a high profile publication of the main findings. It might also be possible that the process of this research helped to drive some of the improvements we have seen in the levels of engagement above.

Research findings

Company and brand ownership

Since Ethical Consumer rates companies mainly by the policies and conduct of their ultimate parent company, the research started with a dive into who owned the various brands.

As expected, several well-known brands belonged to lesser known parent companies and some of the large companies owned competing brands that they market separately.

AB Electrolux, for example, was found to also make AEG and Zanussi, and Whirlpool owns Hotpoint and Indesit. Siemens’ white goods are actually made by a company fully owned by Bosch, and Philips televisions now come from an independent Chinese company called TPV Technology.

Carbon management and reporting (Max 35 points)

In 2020, Ethical Consumer introduced a new carbon management and reporting category, which was in part based on what we found out about current standards of reporting during this project. To get a thorough idea of what was happening in this field, we collected a wide range of data:

  • Did the company report emissions at least annually?
  • Were carbon data independently verified?
  • Was a widely recognised independent reporting standard used?
  • Were all relevant greenhouse gases reported?
  • Were previous year’s carbon emissions reported alongside the current year?
  • Were absolute emissions as well as an intensity ratio reported?
  • Did reporting cover all emissions a company is responsible for up to and including those in its value chain to at least first tier suppliers (‘scope 3’)?
  • Did the company have a decarbonisation target at least in line with international agreements?
  • Did carbon mitigation and any offsetting strategies use credible named and geographically specific projects only?

Companies clearly started taking carbon reporting more seriously during the reporting period. In the first report, 22 did not report anything on carbon emissions, and only Sony scored 30 or more out of 35. In the final report the number of reporting companies had gone up from 20 to 25, and scores of 30 or more came from Toshiba (34), Sony (33), IKEA (32), Panasonic (31) and Sharp (30).

One of the aspects we were most interested in was the reporting of carbon emissions from companies’ supply chains (‘scope 3’ or ‘indirect emissions’). We were looking specifically for emissions from supplying factories, transport to and from factories or retailers, and product lifecycle emissions. For companies that produce physical goods, this is the bulk of their carbon footprint and can easily amount to 90% of a company’s impact. Accounting for scope 3 emissions is an important step forward in calculating the real carbon cost of a company’s operations.

Unfortunately, the number of companies that reported some or all of these scope 3 emissions only went up by 1 throughout the reporting period, from 7 to 8, although the importance of dealing with supply chain emissions became a more prominent theme in sustainability reports published towards the end of the project period. However, the majority (28 or 64%) failed to demonstrate that they had grasped the necessity to take decisive action.

By the end of the project, 14 companies had a carbon reduction target in line with international agreements. This had been 6 at the start, so this was a significant improvement. In recent sustainability reports, many companies that already report carbon emissions have started to set carbon reduction targets approved by the Science Based Targets initiative (SBTi) or stated they were working with SBTi to formulate them. SBTi considers targets ‘science-based’ if they are “in line with what the latest climate science deems necessary to meet the goals of the Paris Agreement – limiting global warming to well-below 2°C above pre-industrial levels and pursuing efforts to limit warming to 1.5°C”.

We also wanted to explore how companies used ‘offsetting’ in their carbon emissions calculations. ‘Creative carbon accounting’ tends to rely on this controversial practice, which allows companies to fund projects designed to reduce carbon emissions and then subtract these carbon reductions from their own emissions figure.

In our research we found that only IKEA and Sharp relied on the best type – carbon mitigation strategies that directly addressed their own emissions. Other companies did not (fully) explain what type of projects they funded or used strategies such as buying carbon credits. A few traded carbon credits received for carbon-friendly product lines for discounts on carbon emissions from other parts of their production process.

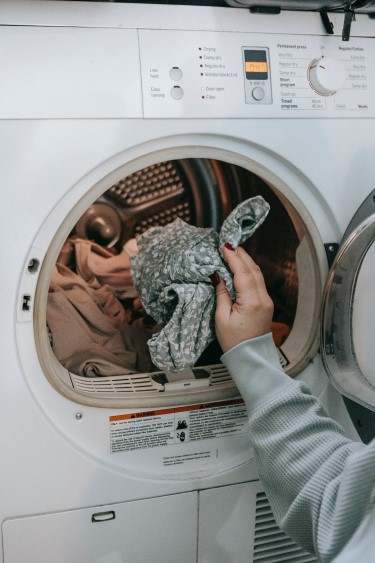
Person putting clothes into a washing machine

Environmental reporting (Max 25 points)

The environmental reporting rating we used was based on our usual Ethiscore category. We looked at whether companies demonstrated a reasonable understanding of their environmental impact, if they had at least two quantified future targets to improve their environmental performance, how up to date the information was, and whether their data was independently verified.

LG, Sharp, Samsung, AB Electrolux and Sony scored full marks in this category throughout the project. Most other companies also continued to score more or less the same. Only BSH Group (+8), JVCKenwood UK (-5), DeLonghi (+3), Haier Group (+5), Numatic (+8) and Stein & Co (+3) scored more than 2 points lower or higher between the first and final report in this category. Overall, 22 companies scored 15 or higher in the final report, with most companies updating their environmental information at least annually.

Toxics (Max 15 points)

More disappointing were the outcomes for the toxic policy rating, which was also based on our usual Ethiscore category.

We looked at whether the companies demonstrated a good understanding of the environmental impact of brominated fire retardants (BFRs) and phthalates, toxics often found in electronics, and whether they had banned or were phasing out these toxics beyond legal requirements.

We found that only twelve companies had any type of policy addressing the use of BFRs and phthalates and only four of these scored more than 5 out of a possible 15 in the final report. AB Electrolux, Toshiba and Adeva added new information during the year. The other nine companies had the same score in all reports. For most, if not all, of these, the policy on toxics in electronics seemed somewhat stale – with no new goals or policy changes found during the project.

The difference between the outcomes for the two ratings was striking. It seems that general environmental reporting has become part of the annual reporting process for most companies but that they are less inclined to set goals for a material issue such as the phasing out of specific toxics. We also found that some companies changed or even dropped environmental targets over time without explanation, which exposes the weakness of rating future promises: it is easy to set a goal if you are willing to drop it in your next report.

EU energy efficiency rating

There was one company that only made products with an A+++ energy efficiency label: UK washing machine manufacturer Ebac. Crosslee, TPV Technology, Sony and Swan made no products with an A+++ label.

Part of this difference was explained by the type of products they made. Of the products we looked at, TPV Technology and Sony only made televisions and none of the televisions we found had an A+++ rating. On the other hand, half of the companies that made washing machines only made A+++ rated products.

In response to our data collection, LG explained that, “Class A+++ cannot be met by current UHD televisions without setting the screen luminance at a very low level”. Tumble-dryers and refrigeration appliances also scored very low in this category.

Companies who produced more than just televisions and scored below 55% of A+++ across all product categories were Crosslee, Montpellier and Swan. Companies that made products in most categories and did not score over 60% in any of them, were Sainsbury’s and Smeg.

Further reading

In April 2021, Ethical Consumer published a shopping guide on fridges and freezers, which includes many of the companies in this project. If you are interested in how white goods impact the environment or how white goods companies score on tax conduct and production of military equipment, click to read the guide.

Our new annual Climate Gap Report: Consumer actions, tracks the UK’s collective progress towards sustainable consumer lifestyles and sets targets for cutting our emissions. It provides a benchmark for individual and collective action across four key sectors (food, heating, transport and consumer goods), setting reduction targets for each.

End note: Working on this project for Ethical Consumer were: Marlous Veldt, Joel David Taylor, Mackenzie Denyer, and Rob Harrison.